Kris Schultz
Design Director 20+ years of experience Copenhagen, Denmark Montreal, Canada Seattle, USA

Turning complexity into clarity. Vision into impact.

I lead teams in rethinking how work gets done – connecting business strategy, human-centered design, and intelligent systems to simplify complex enterprise experiences and deliver measurable impact.

Leadership

I turn fragmented enterprise experiences into coherent, intelligent systems.

Designing beyond screens: the strategy, systems, governance and teams that make a transformation hold.

Clarity

Start with questions

Research and cross-functional alignment set a shared direction. Then teams run.

Scope

Operate across the system

Strategy, experience architecture, design systems and governance, not interfaces alone.

Simplicity

Simplify work end to end

Remove unnecessary tools, handoffs and redundant interfaces across the whole workflow.

Outcomes

Tie design to results

Align stakeholders around customer jobs and measurable outcomes.

Teams I’ve built and led
Microsoft · 2020–Present 22people in my organization
  • 12 direct reports, including 2 Design Leads with 5 reports each
  • Hired about half the team; the rest joined through reorganizations
  • Partner Center, Azure Design System and Azure Copilot
Unity Technologies · 2017–2020 20people, grown from 4 in three years
  • 2 Design Leads, with 6 and 7 reports
  • 1 UX Research Lead with 3 reports
  • Across Copenhagen, Montreal and Seattle
In the words of the people I work with
“The design system and copilot spaces wouldn’t be where they are without your incredible vision and storytelling abilities.”
Strategic visionPeer feedback
“Every issue we’ve faced as a team was met with level headedness, thoughtful questions, and an action plan shared early and transparently.”
LeadershipTeam feedback
“You’ve helped me build confidence in my work, focus on what matters, apologize less…”
MentorshipTeam feedback
Resume

Enterprise Design & AI Transformation Leader

Transforming complex enterprise experiences into simple, scalable, AI-powered systems by connecting business strategy, human-centered design, and emerging technologies to deliver meaningful, measurable outcomes.

2020 – Present

Design Director

Microsoft · Redmond, WA

Shaping the systems, strategy and organizational alignment that let the Azure ecosystem deliver more coherent, scalable and intelligent experiences, across Partner Center, the Azure Design System and Azure Copilot.

2017 – 2020

Director of UX, R&D

Unity Technologies · Seattle, WA

Built a global user research and design team from the ground up, responsible for the overall user experience of Unity’s products and services for creators.

2005 – 2016

Principal Designer & Manager

Microsoft · Redmond, WA

Worked across high-impact products including Visual Studio, VS Code, Speech I/O, Connected Car, IoT, Wearables and the Windows Mixed Reality platform.

1998 – 2004

Designer

Navision · Copenhagen, Denmark

Founding designer on Navision’s ERP solution, AX, later acquired by Microsoft and now part of the Dynamics 365 product line used by millions of businesses.

Education & training
  • Computer ScienceCopenhagen Business Academy · 1994–1998
  • UX Leadership Program, graduateMicrosoft · 2010
  • Leadership TrainingUnity Technologies · 2018
Leadership
  • People management
  • Design strategy
  • Envisioning
  • Agentic experience design
Craft
  • Enterprise UX
  • Design systems
  • Information architecture
  • Interaction design
Contact

Open to Director, VP and Head of Experience roles, and to AI transformation advisory work.

Portrait of Kris Schultz
← All work Transforming business experiences

From fragmented tools to an intelligent partner platform that guides.

ProductMicrosoft Partner Center & Marketplace
RoleDesign Director, UX strategy and design
ScopeCo-Sell, SMC Accelerate, Marketplace Offers
ProofSeven shared business outcomes
95%

Faster procurement cycle, from about 60 days to 3: a 57-day reduction.

Shared outcome
$20M+

Invoiced revenue across five completed REO Private Offers deals in an eight-week private preview, an experience my team’s research and design helped improve.

Shared outcome
37→4days

Time for partners to create and deploy a SaaS offer with Copilot, about 89% faster (80th percentile, early five-partner preview).

Copilot
Overview

I led UX strategy and design across the partner ecosystem, connecting customer pain points to practical investment choices.

Across Partner-initiated Co-Sell, SMC Accelerate and Marketplace Offers, my team combined customer research, end-to-end journey design, AI and agentic concepts, and design-system thinking. The aim was to simplify complex workflows, create shared future-state visions and influence the product roadmap.

The stakes were commercial. SaaS represented more than 75% of Marketplace billed sales, Private Offers were part of more than half of Co-Sell deals, and those same workflows absorbed 89% of CMS Assist capacity. The strongest contribution was turning that friction into reusable patterns and aligning cross-functional stakeholders around more proactive, scalable partner experiences.

Partner-initiated Co-Sell01End-to-end North Star
SMC Accelerate02Agentic future-state vision
Marketplace Offers03Publishing & deal-making
01 · Partner-initiated Co-Sell

A research-informed North Star for Co-Sell, rather than a set of isolated screens.

The problem

Co-Sell is how partners and Microsoft sellers win deals together, and Private Offers were part of more than half of those deals. Yet research with customers, partners and sellers from 2023 to 2024 kept surfacing the same four problems:

  • Incentive programs were overly complex, and claims for reimbursement were hard to submit.
  • Partners felt they got too few leads from Microsoft, so the relationship felt one-sided.
  • People were overloaded with fragmented tools, workspaces and disconnected workflows.
  • Conflicts of interest between Microsoft sellers and partners reduced trust.
Impact
Led the Co-Sell Northstar as an end-to-end vision. It connected partner, seller, incentive, referral, proposal and private-offer perspectives, with shared terminology across personas and swim lanes.
Research insight
Stakeholder review surfaced critical comprehension and trust needs, including whether accepting a Co-Sell engagement meant agreeing to begin work, rather than simply expressing interest.
Design contribution
Explored AI-supported opportunity pre-qualification, contextual history and insights, recommended actions, and guided progression through an engagement. Added clearer explanatory content at consequential moments and designed patterns that could extend to other Partner Center journeys.
Outcome
The vision generated leadership interest, broader follow-up requests and demand for a workshop with GPS stakeholders. It also created a stronger shared understanding of the end-to-end journey and the dependencies across capabilities.
Recognition
Product partners valued the collaboration while asking for deeper enterprise-seller research. The team adjusted scope, removed premature areas and scheduled focused reviews, strengthening trust without losing strategic momentum.
Vision storyboard

One engagement, from fund to payment, across every role.

The full storyboard, in order: research and framing, then a single engagement through configuration, claim, proposal, co-sell, deal making and compensation, showing where AI pre-qualifies, recommends and drafts, and where people stay in control.

Co-Sell Northstar · Vision storyboard1 / 111
Fig. 2.1Co-Sell Journey Northstar Vision. C+E Studio, December 2024.
02 · SMC Accelerate

An agentic future-state vision for serving small and medium-sized customers at scale.

The problem

Microsoft relies on CSP partners to reach small and medium-sized customers, but serving that market at scale was slowed by a long chain of manual steps: enrolling, building and verifying a partner profile, finding opportunities, choosing benefits, and setting up each new customer. The existing AI Assistant could answer questions but not carry out the work, and partners needed clear transparency, control and validation before they would trust AI to act on their behalf.

Impact
Drove a future-state vision to help CSP partners serve small and medium-sized customers at greater scale. Brought research, product, engineering, marketing and business inputs into current- and future-state journey maps.
Research insight
Research with 12 active Partner Center users across roles, experience levels, company sizes and regions explored where proactive versus user-initiated AI assistance was valuable, and which transparency, control and validation signals were required for trust.
Design contribution
Created agentic concepts for enrollment, partner-profile creation and verification, opportunity discovery, benefit selection and automated next steps, made concrete with verified-information indicators, conversational continuity and next-best actions.
Wave 1 in production
The foundation is live: by September 2025, the Partner Center AI Assistant was generally available in 8 locales and across 12 Commercial and Marketplace workspaces, with launch communications reporting consistent month-over-month engagement growth. Leaders praised the team’s quality bar, its deliberate use of data to define launch criteria, and patterns that could guide future AI launches.
Outcome
Influenced near-term investment discussions around visibility and account settings, and established a foundation for longer-term roadmap planning.
Recognition
The April business review credited the Partner vertical with producing as-is and desired future-state journeys that created clarity and stakeholder alignment around SMC Accelerate.
Vision storyboard

From an assistant that answers to agents that act, wave by wave.

The full storyboard, in order: the Partner AI Assistant in production today, an agentic assistant that takes a new partner from intent to provisioned customer, and agents that carry the same work into a distributor’s own portal and the Azure portal. At every consequential step, the partner reviews and decides.

SMC Accelerate · Vision storyboard1 / 32
Fig. 2.2SMC Accelerate. A North Star vision for agentic partner experiences, May 2025.
03 · Marketplace Offers

From tactical delivery to a clear UX point of view for ISV publishing.

The problem

Creating and publishing offers was where partners got stuck, in the workflows behind more than 75% of Marketplace billed sales. SaaS offer creation was the single largest support driver, and SaaS and Private Offers together consumed 89% of CMS Assist capacity. One partner had 20 SaaS offers stalled on technical configuration. Meanwhile, design was delivering features reactively, without a clear point of view for the publishing experience as a whole.

Impact
Coached the team beyond tactical delivery to establish a stronger UX point of view for ISV and publishing experiences. The redesigned SaaS offer flow introduced categorized offer selection, guided creation, an Offer Overview, clearer progress and next steps, and support for saving and returning later.
Research insight
The direction was put into moderated usability testing with 7 SaaS partners. Broader Marketplace feedback reinforced demand for stronger self-service publishing and onboarding, personalized recommendations, intelligent filtering, natural-language search, Copilot integration, comparison tools and streamlined procurement.
Design contribution
Reduced publishing complexity through clearer sequencing and descriptions, progressive disclosure, progress visibility and assisted experiences such as Copilot. The team also supported private-offer and deal-making experiences that helped partners progress from setup to transaction.
Recognition
Partners praised the clear sequence and descriptions in the professional-services publishing experience. Leaders recognized the quality of the REO UX, which received positive feedback from partners at Ignite.
Insights workspace

Reporting organized around the questions partners ask.

Offer reporting follows the same task-oriented structure: one summary of orders, customers, usage and page visits, each linking to a deeper dashboard. The AI Assistant then lets partners ask about their own business directly and points them to the right view.

WorkspaceOffers summary
Fig. 2.3Marketplace offers summary in the Insights workspace. Data shown is illustrative.
With AI AssistantAsk about your business
Fig. 2.4The assistant answers a question about recent purchases in context and links to the relevant view. Data shown is illustrative.
From intent to offer

Describe the deal in plain language; Copilot drafts the offers for review.

A partner states the commercial terms agreed with a customer. Copilot proposes how to model them as Private Offers, then pre-populates the offer setup for the partner to review, complete and submit, with undo always available.

Step 1Describe the deal
Fig. 2.5Copilot turns plain-language deal terms into a proposed structure of two Private Offers, and asks before creating them.
Step 2Review and submit
Fig. 2.6Both offers are created as drafts; the partner reviews pre-populated terms before submitting, and can undo.
Outcomes

Seven measurable business outcomes.

These are shared outcomes that the team’s design work helped influence, not results attributable solely to UX.

Professional-services offer publishing

Before20 transactable offers targeted

After45 offers across 24 partners, generating about $3.7M in billed sales

2.25×target, or 125% above goal

UK and Canada Multiparty Private Offers

BeforeTargets of 8 purchases, 12 ISVs and 10 channel partners

After11 purchases, 13 ISVs and 12 channel partners; more than $5.5M transacted in 7 weeks

+37.5%purchases above target; channel partners +20%, ISVs +8.3%; satisfaction 4.9/5

REO Private Offers

BeforeA new Private Offers capability, launched as an eight-week private preview

AfterFive completed deals, generally available November 2025

$20M+invoiced revenue in the eight-week preview

Copilot SaaS-offer creation

BeforeOne partner reported 20 SaaS offers stalled by technical configuration

After153 offers created and deployed in 30 days, with 65 hours of usage

⅓approximately one-third of all new SaaS offers

Copilot offer creation time

BeforeAbout 37 days to create and deploy a SaaS offer (80th percentile); 167 days at the 95th

After4 days with Copilot; 5 days at the 95th percentile

−33 daysabout 89% faster, roughly 9×; early preview with five partners

Procurement cycle

BeforeAbout 60 days

After3 days

−57 daysapproximately 95% faster

Marketplace Experiences billed sales

Before$3.6B target

AfterJust under $4.2B

+16.7%approximately $600M above target; portfolio-level business context

AttributionMy team helped shape and improve the experiences behind these outcomes. The results reflect shared execution across design, research, product, engineering, sales, marketing and partners. Our clearest contribution was reducing friction, clarifying critical workflows, improving partner confidence and creating scalable patterns that contributed to adoption and business growth. Metrics are as reported in source communications; portfolio-level revenue and billed-sales figures are business context, not design-only results.
Leadership impact
Strategic clarity

Shared end-to-end visions

Helped stakeholders understand partner journeys and align around priority investments.

Customer-centered decisions

From pain points to plans

Converted research and customer pain points into practical experience changes, roadmap discussions and validation plans.

Cross-functional influence

Coherent outcomes

Connected design, research, product, engineering, marketing, sales and business stakeholders around coherent outcomes.

Scalable foundations

Reusable patterns

Established reusable AI, navigation, guidance, dashboard and next-best-action patterns that could extend across Partner Center experiences.

What it shows

Experience strategy, connected to commercial outcomes, carried by cross-functional alignment.

← All work Transforming how work gets done with AI

A coherent, trustworthy AI experience platform.

ProductAzure Copilot & Agents
Period2025 – Present
FocusAgentic UX strategy, patterns, trust
ProofCustomer feedback, adoption, control
−91.6%

Customer thumbs-down feedback per 100,000 turns, from 2,200 to 184 between January and October 2025.

Customer feedback
+56%

Relative growth in adoption, from 3.2% to 5% of Azure Portal customers, reaching 365,000 monthly active users by October 2025.

Adoption
−54%

Time to results when customers can call the right agent directly, instead of being routed through a general assistant. Deployment Agent tasks finished 46% sooner.

Workflow speed
The problem

A solid foundation, but customers weren’t yet getting enough value to depend on it.

Our November 2024 customer benchmark gave us an honest baseline. Overall task success was a strong 78%, but the experience fell short of the study’s reference bars on the measures that predict whether people keep using a product. Speed was the weakest dimension.

Task success78%Strong start, uneven by task
Response accuracy70%Recurring theme
Speed62%Weakest dimension
Satisfaction70%Positive, below the bar
Very disappointed if removed31%Reference bar ≥ 40%
Exceeded expectations30%Reference bar ≥ 40%
Did not save time16%Reference bar ≤ 10%
Negative feelings15%Reference bar ≤ 10%

Task-level gaps were sharper still. Four of 16 benchmark tasks scored below 70%. On one AKS namespace task, actual success was 13.6% while perceived success was 40.9%, meaning customers often believed the work was done when it wasn’t. Participants described inaccurate or inconsistent answers, irrelevant resource pickers, slow responses, and answers that explained how to do the work rather than doing it.

My role & decisions

I framed agents around jobs to be done, not organizational boundaries, and moved assistance into the customer’s workflow.

I led and influenced Copilot and agentic UX strategy, patterns and coherence across teams, moving from disconnected AI features toward reusable interaction patterns and decisions grounded in customer evidence.

  • Context first. Customers expected Copilot to understand the active resource, page, subscription and recent action. We supplied portal context to agents, improved resource selection and grounding, and added inline entry points, nudges and Spaces for persistent workload context.
  • One Copilot, many specialists. A general Copilot that coordinates specialist agents, so customers don’t have to pick an organizationally defined agent.
  • Direct Agent Invocation. When customers do know which agent they need, they can go straight to it. Total runtime fell about 54% for the Optimization Agent and 46% for the Deployment Agent.
  • Sidecar first. Telemetry showed only 3.35% of users maximized Copilot to full screen, so we prioritized agent discovery in the sidecar, where customers actually work.
  • Shared components. Shipped reusable components including Top Actions; eight partner teams adopted the official Inline Copilot components, alongside 20+ new Figma components and patterns.
Spaces

Persistent context for a workload, so every question starts grounded.

Customers expected Copilot to understand the resources and scope they were working in, and continuity research showed how much they relied on returning to earlier work. Spaces give a workload a lasting home: the customer gathers the relevant resources once, Copilot suggests related ones, and every question asked in the space is grounded in that context.

Spaces · Cost investigation1 / 17
Fig. 1.1Copilot beside the work. Copilot opens in the portal sidecar, next to the resources the customer is already looking at.
Research into change

Continuity turned out to be core workflow infrastructure, not a convenience.

Customers relied on chat history to resume and reuse work, yet most struggled to find it again. Some settled for the wrong conversation, which caused errors downstream.

Rated chat history important89%Core infrastructure
Used history to resume work53%Multi-session work
Struggled to recover a chat78%Major friction point
Settled for the wrong chat20%Led to workflow errors

We responded with an in-context history tooltip, clearer switching and opt-out copy, an agent selector shipped for Ignite, and a navigation rail with a dedicated Agents entry planned for testing.

For future-state work, iterative research on the Deployment Agent produced a concept participants rated ahead of competing tools. They expected major time savings and faster incident triage, but trust trailed value: before delegating critical work, they wanted production proof, inspectable reasoning, audit trails, clear permissions and rollback.

Perceived value5 / 5
Adoption readiness4 / 5
Trust3.6 / 5
Trust & governance

We made control and governance first-class UX requirements.

In our MCP and tools study, six of eight participants repeatedly failed to find per-tool controls, even when they understood the concepts. Participants converged on a consistent risk model, which became the basis for our direction: tool configuration as a clearly labeled top-level entry point, administrator-owned defaults with bounded exceptions, and audit and observability at the agent-tool level.

Read

Generally allowed

Write

Role-restricted or approval-gated

Delete

Gated or disabled

MCP servers

Administrator-owned selection and baseline permissions

History

Durable, reviewable and auditable

A separate 13-participant agent-framework study reached the same conclusion: trust comes from visible actions, clear costs, and easy approval or undo.

We set a quality bar across five dimensions (pattern alignment, workflows and output, language, trust and user control, and accessibility) and put it into practice through self-assessments, UX reviews, scorecards and evaluations in a testing environment. By September 2026, audits were initial or completed for Migration Agent, Storage Mover and Deployment Agent, with Troubleshooting Agent in progress.

Troubleshooting Agent

Know the agent before you hand it work.

Each agent introduces itself before the first task: what it does, who built it, and what it is allowed to do. Plans are shown for review, and work continues only when the customer chooses to proceed.

Fig. 1.2Agent details up front: features, publisher, version and permissions, including that it acts only with the customer’s approval.
Fig. 1.3A focused starting point, with prompt starters for common problems.
Fig. 1.4Reasoning time is shown, and a reviewable plan waits for the customer to continue.
Agent identity

Agents as accountable identities, not anonymous helpers.

As agents act in customers’ environments, people need to know whose authority an agent is using, who else can see the work, and exactly what it did. This design exploration gives agents a managed identity, makes collaboration explicit, and shows every action with its permission level, putting the risk model above into the interface.

Design exploration · Agent identity1 / 8
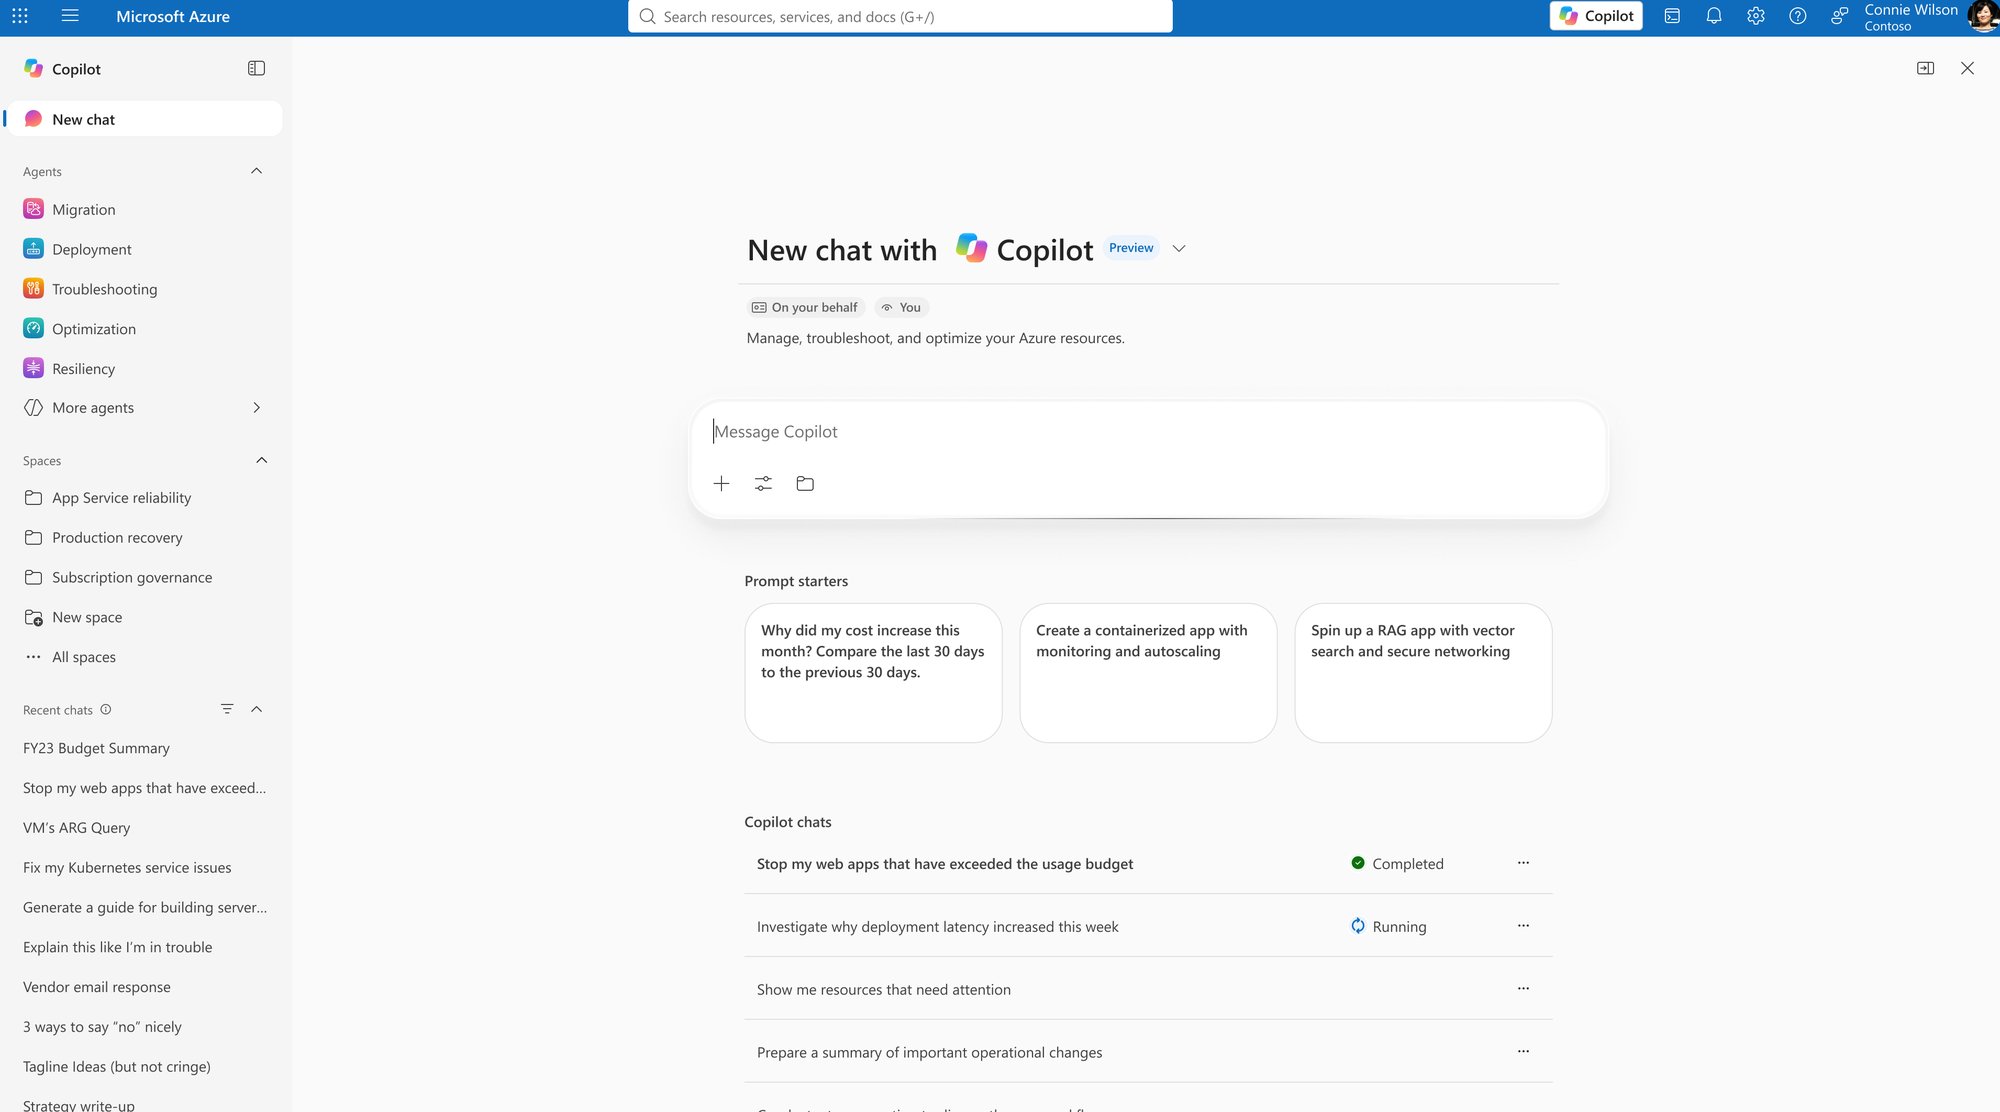
Fig. 1.5Copilot works on your behalf. Badges make clear that Copilot acts as the signed-in user, and recent chats show their status at a glance.
Outcomes

Customers reported far less friction, and more of them came back.

  • Response friction fell sharply. Thumbs-down feedback per 100,000 turns dropped from 2,200 to 184 between January and October 2025, a 91.6% reduction. It is the clearest quantified quality signal, because it reflects customers explicitly reacting to responses.
  • Adoption and repeat use grew. After general availability, usage rose from 3.2% to 5% of Azure Portal customers, reaching 365,000 monthly active users. Inline experiences carried 19% of traffic and portal nudges 36%; Prompt Ribbon use grew 16% month over month after launch.
  • Contextual beat generic. Inline experiences recorded 3 thumbs-downs per 100,000 turns versus 186 for chat. That evidence shifted investment toward inline, grounded, workflow-aware experiences.
  • Support demand declined directionally. Among Copilot-engaged users, support-case creation fell a reported 3–4% month over month, across roughly 4,000 cases.
  • A visible failure was caught and corrected. When a sidecar streaming issue spiked “No Response” and “Token Limit” feedback in Q4 FY26, rates returned to the pre-incident baseline after the fix.
Lessons learned
01

Bring the help to where the work happens. Telemetry showed only 3.35% of users ever expanded Copilot to full screen. People don’t want a bigger chat window; they want help in the place they’re already working.

02

Organize agents around the customer’s job, not the org chart. Customers shouldn’t have to know which team built which agent. One Copilot that coordinates the specialists is simpler than a menu of agents grouped by team.

03

Trust is earned in the moments that could go wrong. Customers feared irreversible actions more than they wanted full automation. Confirmations for high-impact steps, visible reasoning and a clear way to undo built more confidence than autonomy did. The question isn’t only “can the agent do it?” but “should it, and with whose oversight?”

04

Perceived success isn’t success. On one AKS task, customers believed they’d succeeded 40.9% of the time when actual success was 13.6%. Sentiment metrics such as thumbs-down are useful signals, but only task outcomes tell you whether the work actually got done.

05

Quality has to be operational, not aspirational. Principles only changed decisions once they became a shared quality bar, with scorecards, UX reviews and agent audits that teams could act on.

06

Coherence scales through reuse, not mandates. Without direct authority over most teams, shared components did more than guidelines ever could. Eight partner teams adopting the same Copilot components did more for a consistent experience than any review.

What’s still open

Customers still tell us where we fall short, and that shapes what comes next.

Self-selected feedback channels remain a useful friction lens: 1,814 verbatims from April to June 2026 and 1,750 scorecard comments from July to September 2026 pointed to misalignment with portal data or intent, thin Azure context, failures without recovery guidance, and context lost across turns. A late-2026 diary study found Copilot reviewing only 98 of 449 VMs without explaining the gap or offering to continue.

Accuracy, completeness, context, transparency, cost clarity, interoperability and governance remain the main barriers to deeper adoption. The next milestone is a like-for-like rerun of the 2024 benchmark, so improvement in end-to-end task success can be measured rather than inferred.

Evidence
MeasureResultHow to read it
Response frictionThumbs-down per 100,000 turns: 2,200 → 184, Jan–Oct 2025 (−91.6%)Explicit customer reaction; voluntary, not task success
Adoption3.2% → 5% of Azure Portal customers (+56.3% relative); 365,000 MAU by Oct 2025Behavioral evidence of value
Inline vs. chat3 vs. 186 thumbs-down per 100,000 turns (62× lower)Cross-surface comparison, not a controlled test
Support demand3–4% month-over-month reduction in support cases among Copilot-engaged users (~4,000 cases)Associative; not proof of causation
Discovery channelsInline 19% and portal nudges 36% of traffic; Prompt Ribbon +16% month over monthContext for embedded strategy
Direct Agent InvocationOptimization Agent runtime −54%; Deployment Agent runtime −46%Direct workflow improvement
Reuse at scale8 partner teams on Inline Copilot components; 20+ new Figma components and patternsPlatform adoption and reuse
Governance research6 of 8 participants couldn’t find per-tool controls; 13-participant framework studyBasis for the permission model
Deployment Agent conceptValue 5/5; adoption readiness 4/5; trust 3.6/5Concept study, not production performance
Quality governance5 quality dimensions; 3 agent audits initial or completed by Sep 2026, 1 in progressStandards in operation
AttributionAzure Copilot substantially improved customer-reported response quality and adoption, with research-validated gains in context, discoverability, continuity and control. These are product outcomes delivered by a multi-disciplinary organization. A comparable rerun of the November 2024 benchmark is still needed before claiming improved end-to-end task success, satisfaction or trust.
← All work Transforming creator platforms

The most significant UX update to Unity in more than a decade.

CompanyUnity Technologies
Period2017 – 2020
RoleDirector of UX, R&D
TeamGrew from 4 to 20, across Copenhagen, Montreal and Seattle
57→87%

Average task success across seven core creation tasks, from the current editor to the redesign. Average happiness rose from 5.3 to 6.4 out of 7.

Usability
93→71%

New-user drop-off rate, reduced from 93% to 71% as of December 2019.

Retention
4→20

People in a global, diverse design team built in three years, across Copenhagen, Montreal and Seattle.

Team
Unity RedesignThe redesigned editor
Fig. 3.1The redesigned Unity editor: a consistent, modern interface that puts the creator's content first.
Overview

I led the vision and execution of the redesign from discovery to delivery, and built the global team that delivered it.

Millions of creators use Unity every month, and as it grew into the world's leading real-time creation platform its editor grew organically with it. For a productivity tool people use often and for long stretches, ease of use and efficiency are everything.

The problem

Extensive user research, studies and surveys surfaced four problem areas:

  • Consistency. Rapid, organic growth left a highly inconsistent UI that was hard for new users, especially creatives, to learn.
  • Workflow. Workflows were clunky, poorly integrated and unfamiliar to non-technical users.
  • Accessibility. Unity was not accessible to everyone, regardless of disability or special needs.
  • Aesthetics. The editor's look and feel was dated, off brand, and not on par with the quality the engine could render.
Role
Led the vision and execution of the redesign from discovery to delivery, and facilitated an inclusive, human-centered design process.
Team
In parallel with this multi-year effort, grew a global team of user researchers and designers from 4 to 20 people in three years, across Copenhagen, Montreal and Seattle, led by 2 Design Leads and a UX Research Lead.
Outcome
The response from users was highly positive, with measurable gains in retention and satisfaction.
Process

Discover, design, deliver

A double-diamond process, run as hands-on workshops with researchers, designers and product teams across the three studios.

Fig. 3.2The process: diverge and converge through discovery, design and delivery.
Research findingsWorkshops
Fig. 3.3Discovery workshop.
Fig. 3.4Synthesizing findings on the wall.
Research

What creators told us

“I feel that the current app (Unity) is outdated.”
Game Developer
“I feel like existing Unity has an issue with an overload of complexity and density.”
Game Developer
“Trying to get artists to use a new tool especially they are deeply integrated into using something else, it’s like pulling teeth.”
Game Artist
“When using it (Unity) today, it is really disappointing, depressing.”
Game Designer

Key findings

57% average task success across seven core creation tasks in the current editor.

Task testing

Unity was behind on accessibility compliance, for example Section 508.

Accessibility

Artists and designers think about their idea and content first when diving into creation workflows.

User research
Fig. 3.5The State of Unity UX 2017 baseline that framed the redesign.
Mission & users

We believe the world is a better place with more creators in it.

The mission: empower the success of the world's creators with the most powerful and accessible real-time 3D engine and monetization platform. The redesign targeted three core personas: the game developer, the game artist and the game designer.

1M

Monthly active Unity users.

Audience
8/10

Users at AAA game studios are artists or designers, not programmers.

Audience
My mandate
01

Create a UX vision, strategy and roadmap.

02

Build a world-class design team.

03

Institute a design process that drives user adoption and satisfaction.

Fig. 3.6Target users: game developer, game artist and game designer.
Customer journey

Game development journey

Pain points mapped across every stage of making a game, from pitch to monetization.

DimensionPre-productionProductionPost-production
ActivitiesPitch, project plan, proof of concept, prototype, storyline, storyboarding, concept artGame mechanics, game economy, level design, UI design, world building, lighting, programming, animation, art and audio production, QA testingLaunch, deployment, maintenance, customer service, patches and updates, analytics, monetization
RolesCreative director, game designer, concept artist, script writerTechnical artist, animator, UI designer, developer, producer, audio engineer, quality assuranceBeta tester, sales, marketing, business analyst
Pain pointsOnboarding friction and dead ends hurt adoption and retention. Teams relied on programmers to get anything done. Pre-production tools weren't accessible or familiar to creatives.Scalability: problems grow with project size. Collaboration: users can't easily iterate with others. Discoverability: functionality is located unintuitively and inconsistently. Configuration friction: more time spent tweaking settings. Cognitive load: too much to remember.Services were poorly integrated and hard to discover. A multitude of sites and disparate pages made wayfinding cumbersome.
Customer journeyWorkshop
Fig. 3.7Mapping the game development journey with the team.
Strategic framework

Design principles

Fig. 3.8Clustering the team’s input into six design principles.
01

Flow state

Help individuals and teams reach their objectives with the least effort and a strong sense of flow.

02

Powerful yet accessible

Lower the barrier to entry for new users and empower experts to take full advantage of the tool.

03

Content first

Let creators focus on their content and on bringing their ideas to life.

04

Contextual

Surface what's relevant to the current activity, hide what isn't, and use what we know about the user to drive relevance.

05

Familiar and consistent

Use established industry patterns so users feel at home, and stay consistent with the HIG to build trust and recognition.

06

Less is more

Reuse existing functionality and interactions to reduce surface area and cognitive load.

Outcomes & measures

Experience outcomes, written from the creator's side

  • As a creator, I can create and author content in a state of flow, and my tools don't get in the way.
  • As a creator, I can easily discover the tools and commands available to me, and transfer what I learn in one area to all others.
  • As a creator, the experience for authoring content feels familiar, intuitive, efficient and delightful.
  • As an expert creator, I can configure my tool layout to fit my work style and keep multiple tool collections open at once.

KPIs: task success, satisfaction, attractiveness and retention.

Fig. 3.9Aligning the team on experience outcomes and KPIs.
Fig. 3.10One visual language across editor windows.
Fig. 3.11Redesigned panels and controls.
Fig. 3.12The same patterns applied to a node-based graph editor.
BeforeUnity editor, 2017
Fig. 3.13The editor before the redesign.
AfterUnity Redesign
Fig. 3.14The redesigned editor.
Systems

A refresh at platform scale

Beyond layout, the team rebuilt the editor’s visual foundations so the new look could scale across every window.

5,000+

Icons refreshed.

Iconography
300+

Hardcoded styles turned into reusable parameters.

Theming
Fig. 3.15Part of the refreshed icon set.
Design exploration

Scene tools and gizmos

Explorations for the in-scene manipulation tools, tested on light and dark scenes.

Fig. 3.16Rotation gizmo explorations.
Fig. 3.17Move-tool and axis explorations.
Fig. 3.18Camera and lighting tool explorations.
Storyboarding & prototyping

From sketches to a clickable vision

Storyboards sketched the core creation tasks step by step, then became prototypes the team reviewed and tested together.

Design explorationStoryboards
Fig. 3.19Storyboard sketches for the core creation tasks.
Fig. 3.20Sketching contextual asset browsing.
Fig. 3.21Storyboard review with the team.
Fig. 3.22Storyboards turned into prototype frames.
Unity Redesign · Northstar “Walk” prototype1 / 21
Fig. 3.23Northstar “Walk”. A wireframe walkthrough of the redesigned editor: workspaces, document model, main menu, and tools, commands and settings.
Delivery

Crawl, walk, run

Rather than a rip-and-replace, the redesign shipped in phases. “Crawl” shipped in Unity 2019.3, with “Walk” planned for 2020 and “Run” for 2021, so creators got value early while the larger changes followed.

  1. Crawl · shipped 2019
  2. Walk · planned 2020
  3. Run · coming 2021
ShippedCrawl · 2019
Fig. 3.24“Crawl”, shipped in Unity 2019.3.
PlannedWalk · 2020
Fig. 3.25“Walk”, planned for 2020.
Creator feedback

How creators responded

Task testing against the current editor, a survey of 577 users, and retention after release. In testing, average task success rose from 57% to about 87%, and average happiness from 5.3 to 6.4 out of 7. The biggest gain: manipulating a game object went from 25% to 100% success.

Task testingUX scorecard
Fig. 3.26UX scorecard: task success and happiness for seven core tasks, current Unity against the redesign.
“Designers and artists will feel more at home here.”
Usability test participant, redesign
“It feels natural to me. It makes me want to play around with it.”
Usability test participant, redesign
“Having a more up to date interface is nice. This feels more modern.”
Usability test participant, redesign
Survey resultsApril 2019 · 577 respondents
Pie chart of survey answers: better 52.2%, same 22.4%, worse 25.5%Better: 52.2%Same: 22.4%Worse: 25.5%

“Do you find the overall experience of the new Unity design to be better, worse, or the same?”

  • Better52.2%
  • Same22.4%
  • Worse25.5%
Fig. 3.27More than half of surveyed users rated the redesign better overall.
Fig. 3.28Unprompted reactions from the community after release.
Beyond the editor
Unity Dashboard · Driving UX alignment across stakeholders, locations and product areas

One experience across Unity’s web, cloud services, editor and hub.

The problem

Unity’s web dashboard and cloud services had grown up separately, each with its own look and navigation. Sign-up conversion was about 1.2% and new project creation 1.04%, 83% of user accounts were inactive after six months, and overall satisfaction (CSAT) was 18.75% across 325 respondents.

Mission
Unify all Cloud Services to streamline and augment the experience for all target users, and drive UX and brand alignment across the product portfolio.
Approach
Three shared foundations: a unified information architecture (contextual, workflow optimized, structured), a common UI framework of page layouts, components, themes and colors, and a common design system of UX patterns, guidelines and a style guide.
Outcome
Sign-up and project creation roughly doubled, inactive accounts fell from 83% to 71%, and satisfaction more than tripled.
BeforeUnity web and cloud services
Fig. 3.29Before: separate services, separate experiences.
Strategic frameworkOne platform
Fig. 3.30Aligning Unity.com, Cloud Services, the Editor and the Hub.
Experience architectureUnified IA
Fig. 3.31A unified information architecture.
Design systemPage layouts
Fig. 3.32Shared page layouts from the common UI framework.
Fig. 3.33The shared color palette.
Fig. 3.34The unified dashboard, with project, monetization and game-health insights in one place.
Fig. 3.35The same visual language in the Editor…
Fig. 3.36…and in the Hub.
Results

User sign-up

Before1.24% conversion

After2.21% conversion

~1.8×more sign-ups

New project creation

Before1.04%

After2.09%

2×more new projects

Inactive accounts after six months

Before83%

After71%

−12 ptsbetter retention

Customer satisfaction (CSAT)

Before18.75%, 325 respondents

After63.11%, 576 respondents

3.4×higher satisfaction

Lessons learned
01

An innovative tech company with a cutting-edge product can still be resistant to change, and so vulnerable to disruption.

02

An all-inclusive vision and relationship building are everything in a highly empowered, distributed, bottom-up culture.

03

Somewhere between rip-and-replace and continuous improvement lies the answer to dealing with legacy UX.

04

Adding the user’s voice is key to avoiding bias and design by committee. Empathy changes the conversation.

05

The leadership skills needed to succeed at Unity were completely different from what I knew. I had to reinvent myself.

06

Demonstrating quick, incremental value early on is key to earning trust and opening the door to strategic influence.

What it shows

Research-led design leadership, from building the team to shipping a measurably better product.

← All work Additional selected work · 2006–Present

Systems, devices and platforms.

Alongside the three featured case studies, a selection of other work: the jobs-based Azure Design System, envisioning for wearables and IoT, and systemic usability work on Dynamics ERP.

CompanyMicrosoft
RolesUX Designer to Design Director
DomainsDesign systems, wearables, IoT, ERP
ProjectsFour, newest first
01 · Azure Design System
Design Director · Microsoft · 2025–Present

From components to a jobs-based experience platform.

The problem

Inconsistent patterns across Azure workflows created friction and fragmented experiences. Many product teams were solving the same customer problems in parallel, with different patterns. A component library alone could keep screens visually consistent, but it could not make whole workflows coherent, and it was not ready for agentic experiences.

Role
Design Director. Advocated for an ecosystem-level design system organized around common customer jobs, not only visual components.
Approach
Mapped proven, reusable patterns to common jobs, defined shared standards across six experience domains, and connected the customer, engineering and NextGen visions into one direction.
Outcome
One Azure design direction and a jobs-based architecture, with workflow KPIs defined. Quantified results such as pattern adoption and conversion are being gathered.
6

Experience domains in one adaptive design system: deterministic, agentic, distributed, generative UI, adaptive app patterns, and behavior and trust standards.

Strategic scope
3

Vision streams connected into one ecosystem direction: customer (3P), engineering (1P), and Portal Archetype / NextGen.

Strategic scope
1

Unifying jobs-based architecture that maps proven reusable patterns to common customer jobs, including AI-assisted work.

Architecture
Portal ArchetypeShared shell
Fig. 4.1The Portal Archetype: one shared shell with consistent home, collection and create patterns that any Azure product can adopt.
Strategic shift

I advocated for a system organized around customer jobs, not only visual components.

Components remain the foundation. Jobs-based patterns extend the system so teams can deliver coherent outcomes across Azure, and prepare for agents.

  • Shifted from component-centric UI consistency to proven reusable patterns mapped to common tasks, including AI-assisted workflows.
  • Defined shared declarative standards across six experience domains.
  • Connected the 3P customer vision, 1P engineering vision, Portal Archetype, distributed experiences and NextGen into one Azure direction emphasizing human judgment and governance.
  • Clarified ecosystem-level principles versus product-specific implementation, linking components, foundations, patterns, IA and documentation.
Strategic frameworkJobs to patterns
Fig. 4.2Products differ; jobs repeat. Each common job, from discover and create to troubleshoot, delegate and approve, maps to one design-system pattern, so experiences stay coherent across the ecosystem.
Experience architectureOne design system
Fig. 4.3One source of design truth for the ecosystem, serving multiple product contexts and built for both humans and AI. Fluent sets the foundation; the Azure Design System adds shared standards, patterns and governance; product teams adopt and contribute through their own templates; and the same knowledge feeds AI tools and agents.
Six domains
01Deterministic UX
02Agentic UX
03Distributed UX
04Generative UI
05Adaptive app patterns
06Behavior & trust standards
Portal Archetype

Resource creation, as one reusable pattern.

The Portal Archetype turns the jobs-to-patterns mapping into a working reference that any product team can adopt. Resource creation is the concrete example: instead of each service building its own flow, the Create job maps to one create-flow pattern, from the collection view through a guided, AI-assisted form.

Portal Archetype · Create flow1 / 5
Fig. 4.4Start from intent. The archetype home opens on a single prompt to search, summarize or act across the workspace, with agent-led starting points beneath it.
Influence

Alignment across a decentralized organization.

I built alignment among Azure Portal, EngOps, Copilot, framework, product, research and design-system groups, and encouraged convergence of parallel efforts toward reusable solutions.

That meant connecting the customer (3P) vision, the engineering (1P) vision, the Portal Archetype, distributed experiences and NextGen into one story people could rally behind.

I also led through ambiguity and reorganizations, and developed designers as systems thinkers with a shared operating direction across functions.

Presentation slide · Azure NextGen3P + 1P
Fig. 4.5From the Azure NextGen presentation: customer (3P) and Microsoft (1P) experiences connected in one intelligence architecture, with Azure as the intelligence layer, agents in the surfaces where work already happens, and governance as a shared control plane.
Measurement

Expanding UX measurement beyond visual compliance.

I pushed for measuring workflow completion, efficiency, satisfaction and conversion, along with data-led prioritization and machine-evaluable standards.

MeasureEvidenceHow to read it
Jobs-based architectureReusable patterns mapped to common customer jobs across the Azure ecosystemStrategic direction
Adaptive design systemSix domains, from deterministic to behavior and trustBreadth of experience governance
Organizational reachPortal, EngOps, Copilot, framework, product and research teams alignedQualitative organizational leverage
Workflow outcomesTask completion, efficiency, satisfaction and conversion defined as KPIsMeasurement model in place
In progressQuantified results such as pattern adoption, resource-creation conversion and effort saved are being gathered. This story is presented on scope and architecture.
02 · Wearables
Design Manager and creative direction · Microsoft · 2015

A point of view on wearables for Windows, published as a 96-page design book.

“In all this abundance of computing power, what is scarce? Human attention. Time.”

Satya Nadella, the framing quote for the book

In the first half of 2015, the Windows IoT Design team explored new product opportunities for the Windows platform to power wearable devices, starting with wrist bands and smart watches. We met with thought leaders across the company to build on their concepts and scenarios, then synthesized that thinking into principles, scenarios, a UX architecture and a visual direction, captured in Wearables // Insights, Principles and Design Direction (June 2015).

Role
Design Manager and creative direction for the Windows IoT Design team’s exploration of wearables.
Approach
Built on concepts from thought leaders across the company, then synthesized principles, headed and headless scenarios and a UX architecture, with a two-week visual design sprint alongside the Basel team.
Outcome
Wearables // Insights, Principles and Design Direction (June 2015): a blueprint for the shell, app models and UI controls, with a preliminary HIG for developers.
Strategic framework

Three design principles

Glanceable

Display only the most distilled, essential content, convey context clearly, and optimize for a glance.

Context aware

Anticipate needs from location and context, and let people move seamlessly between devices, places and services.

Unobtrusive

Design for brief moments of attention, run almost entirely in the background, and keep users in control.

Scenarios

Headed and headless, told as everyday stories

A headed device has a screen and adds touch to voice and gesture. A headless device relies on LEDs, sound, gestures and haptics; with no screen to preoccupy the user, many tasks, like paying or unlocking a door, can be done without looking at the device at all.

HeadedHome: lock front door
Fig. 4.6The same scenario on a headed device, with visual confirmation on screen.
HeadlessHome: lock front door
Fig. 4.7…and on a headless band, confirmed by voice and light.
Fig. 4.8Outdoors: a change in heart rate prompts exercise cards and a favorite playlist.
Fig. 4.9Work: biometric identity carries from wrist to building badge to PC sign-in.
Experience architecture

The blueprint for shell and app

The UX architecture covered everything from shell information architecture to app models, giving engineering the blueprint for the shell infrastructure and UI controls. It supported two paths: a deterministic route to task completion through apps, and a dynamic one through context-aware cards curated by Cortana. It was deliberately aligned with established Windows concepts such as Notification Center, Proactive Canvas and Tiles.

Fig. 4.10Shell UI model: quick actions, notifications, apps and proactive curated cards around the clock face.
Fig. 4.11Contextual awareness across a regular day, from wake-up to bedtime.
Fig. 4.12Taxonomy: from dedicated-purpose embedded devices to all-purpose smart watches.
Fig. 4.13Form factors weighed; rectangle was the recommended canvas.
Customer journey

The Golden Path, from first awareness to extended use

  1. Demand generation
  2. Retail
  3. Physical OOBE
  4. Digital OOBE
  5. First use
  6. Discovery
Fig. 4.14Solution concepts at each stage, such as biometric sign-in at retail and a personalized out-of-box experience.
Visual design

Two visual directions, Pop and Pure, then applied to apps

Direction APop
Fig. 4.15Pop-inspired typography.
Direction BPure
Fig. 4.16Pure-inspired typography.
Fig. 4.17Apps: the messaging flow, one of seven app concepts in the book.
03 · Internet of Things
Design Manager · Microsoft · 2014

Inspiring makers and developers to build connected devices on Windows.

The problem

IoT was being called the next big paradigm shift, with analysts projecting more than 25 billion connected devices by 2020. Two questions shaped the work:

  • How can Microsoft earn mindshare and platform adoption in the Maker community?
  • In a world already saturated with devices to manage, how do new connected devices add real value to people's lives?
Role
Drove and directed several strategic initiatives to advance Microsoft's IoT platform and products.
Approach
Collaborative end-to-end storyboarding, reference designs and prototyping.
Outcome
The UX team helped set the experience direction for makers and developers building connected devices on the Windows IoT platform.
Research findings

Maker persona landscape

Three makers, from first tinkering to taking a product to market.

Research findingsMaker personas
Fig. 4.18The maker persona landscape: Nicki learns by playing, Jaden by making, and Chris wants to take a prototype to market.
Strategic framework

Three design principles

Meet users where they are

Design around where makers come from, their goals, skills and work style. For makers, encourage learning by making.

Appropriate interactions

Simplify and streamline: fewer steps, clear and concise language, and single sign-on wherever possible.

Build relationships

Make an experience people want a relationship with, learning from their habits and continually adding value.

Customer journey

One developer journey, from discovery to scale

Customer journeyOne developer journey
Fig. 4.19Twelve stages, from discovering the platform to scaling a product, grouped into plan, create, and share or sell.
Storyboard

Maker Pro end to end: Chris's garden in a box

The storyboard follows Chris, a Windows developer who wants to build a self-managing indoor garden and pitch it as a business, through every stage of the journey: from finding a tutorial to a working prototype he can demo as a minimum viable product.

Maker Pro · end-to-end storyboard1 / 27
Fig. 4.20Rising Star Maker Journey. An end-to-end storyboard of a pro maker taking an IoT idea to a working prototype on the Windows IoT platform.
04 · Dynamics
UX Designer · Microsoft · 2006

Scaling usability across more than 3,000 pages through common UX patterns.

The problem

Dynamics is a line of ERP solutions for running every part of a business, from human resources and manufacturing to sales orders and procurement. The product UI had become overly complex and difficult to use, and more than 3,000 unique pages, reports and forms needed to improve to address its usability issues.

Role
UX Designer on a global UX team, owning a set of core UX patterns in the platform and working closely with both platform and application teams.
Approach
Took a systemic approach, breaking the entire system down into common UX patterns to scale impact across a massive surface area.
Outcome
Core patterns implemented with the Supplier Relationship Management (SRM) app team in existing and new workflows, carrying usability improvements across a product of 3,000+ pages, reports and forms.
Workflow diagramEnd-to-end scenario
Fig. 4.21End-to-end scenario: the order process traced across roles, used to ground the pattern work.
Fig. 4.22Breaking the system down: printed pages pinned to the wall to find common UX patterns.
Fig. 4.23A role-based workplace: activity centers, frequent tasks and key figures.
Fig. 4.24List page pattern: managing production orders.
Fig. 4.25Task page pattern: evaluating credit limits.
Fig. 4.26Guided task pattern: resolving an invoice dispute with a step-by-step task guide.
← Back to all work